Turning audio to spectrogram is useful when a mix has a problem you can hear but cannot place. The picture will not mix the song for you, and it will not prove anything about ownership or originality, but it can show where energy, noise, gaps, and harshness sit inside the file.
Choose the right file for the first pass
Start with the file that is closest to the source. If you have a WAV file from the session, use that before an MP3 upload. If you only have the released MP3, that is still worth checking, but remember that lossy encoding can add its own high-frequency patterns. A browser tool or audio to spectrogram converter can only show what is inside the file you give it.
For AI music, I usually make three files available before inspection: the original generation, the cleaned version, and the final master. That small set keeps the comparison honest. If the strange whistle is in the original and the cleaned version, the repair did not catch it. If it appears only in the final master, the mastering chain probably pushed something too hard.
Do not start with a heavily normalized social media rip unless the problem exists only there. Platform processing can smear the top end, change loudness, and make the display look busier than the working file. A clean first pass saves you from fixing artifacts that were created after the mix was already finished.
Read the time and frequency axes without overthinking
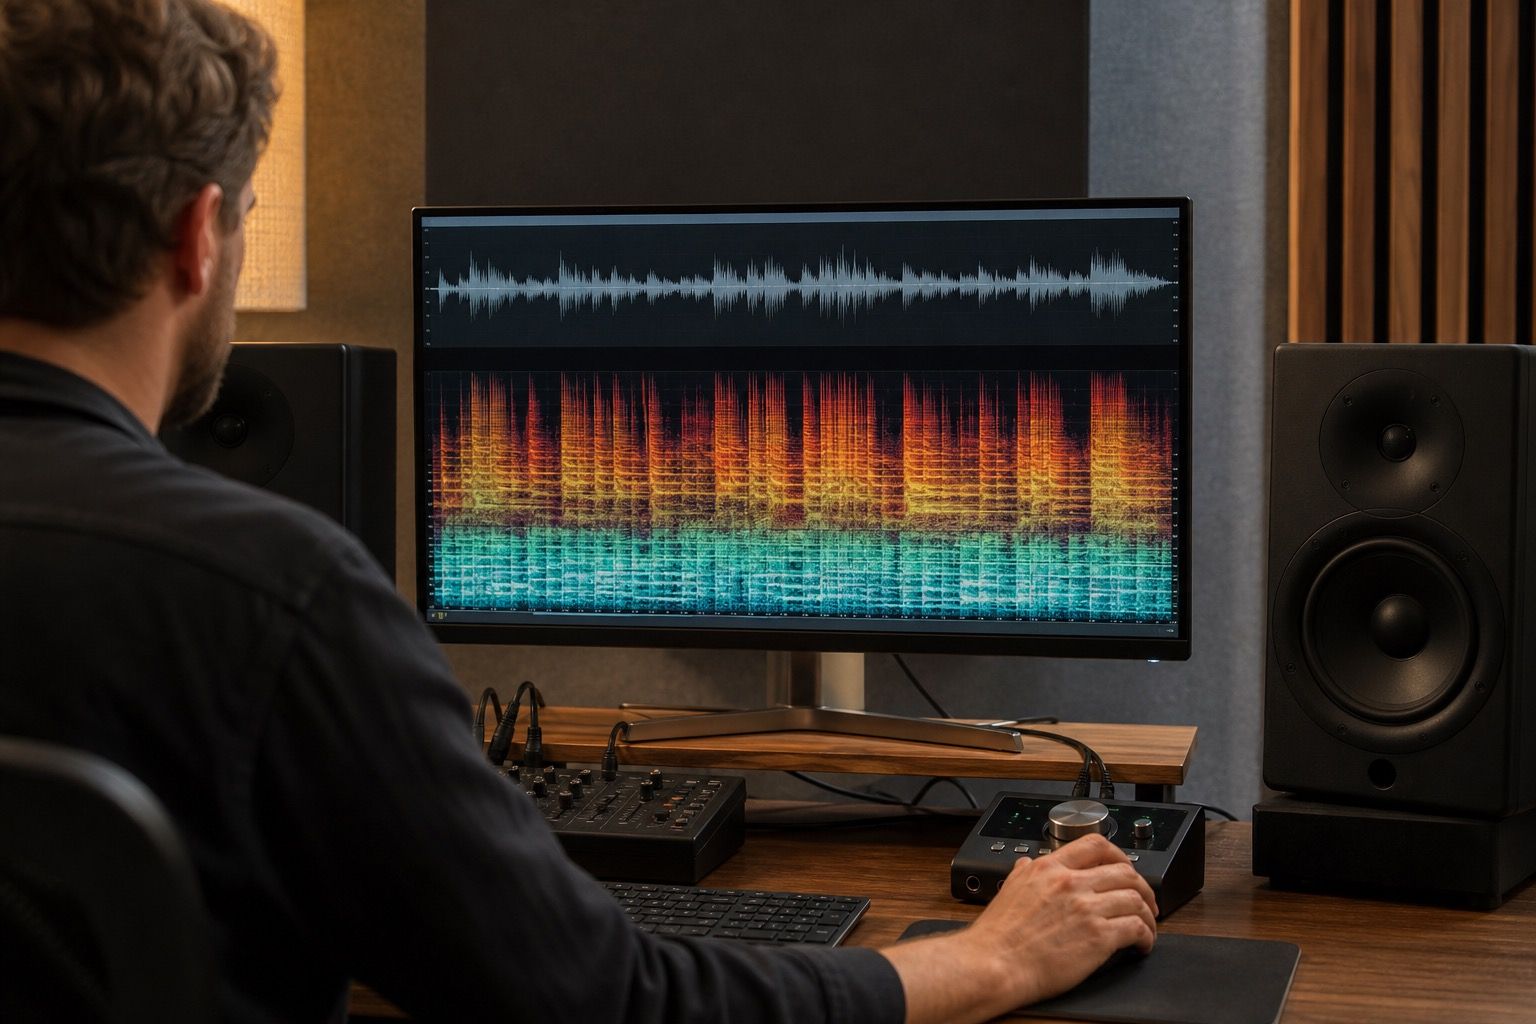
A spectrogram is a map of sound over time. The left-to-right direction is the song timeline. The bottom-to-top direction is frequency, from bass at the bottom to treble at the top. Stronger color usually means stronger energy. That is enough to begin. You do not need to identify every harmonic or explain every mark to use an online audio spectrogram well.
Play a section you already know. Watch where the kick drum appears, where the vocal forms its shapes, and where cymbals or bright noise sit. The goal is to connect the image to what you hear. Once that connection is made, a problem moment becomes easier to find. A harsh word, a silent glitch, or a constant high band has a visible place on the timeline.
The display can feel intimidating because it looks precise. Treat it as a practical sketch, not a courtroom diagram. Different tools use different color scales, window sizes, and smoothing. A mark that looks dramatic in one browser tool may look mild in another. Keep the same settings when comparing versions, and avoid making decisions from a single zoomed-in screenshot.
| Part of the view | What it means | How a musician can use it |
|---|---|---|
| Time axis | Where the sound happens in the song | Find the exact bar or lyric where a glitch appears |
| Frequency axis | How low or high the energy sits | Separate bass rumble, vocal harshness, and top-end fizz |
| Color intensity | How strong the energy is in that area | Compare whether cleanup reduced a noise band |
| Repeated shape | A pattern that returns across the track | Check whether it belongs to an instrument or an artifact |
Find repeated noise bands and sudden dropouts
Repeated noise bands are one of the easiest reasons to convert audio to spectrogram. They may appear as thin horizontal lines, fuzzy shelves, or bright areas that do not follow the music. In AI-generated material, these can come from vocal artifacts, synthetic cymbal textures, resampling, or effects that were printed into the export before you touched the mix.
Use your ears first, then the picture. If you hear a metallic ring around 1:05, inspect that area and look for a narrow mark that appears with the problem. If you hear a breathy hiss through the whole chorus, look near the top of the display. If you hear the vocal momentarily vanish, look for a dark vertical gap or a sudden change in the vocal shape.
Sudden dropouts deserve a different response than constant haze. A dropout may need an edit, a regenerated phrase, a stem replacement, or a repair tool. Constant haze may need EQ, de-essing, less saturation, or a darker reverb return. The spectrogram helps you avoid treating every issue with the same plugin, which is how many mixes become dull without becoming clean.
Compare versions after cleanup
A/B comparison is where the workflow becomes useful. Open the original and write down the problem time. Then open the cleaned file with the same spectrogram settings and inspect the same moment. Look for a smaller version of the problem, not a magically perfect picture. If the line is reduced and the track still sounds alive, the cleanup probably moved in the right direction.
Listen immediately after the visual comparison. A repair can look impressive and still damage the song. Noise reduction may remove breath from a vocal. A steep EQ notch may make one word safer and the next line hollow. A limiter change may reduce clipped-looking blocks while making the chorus feel less exciting. The spectrogram should guide the listening test, not win an argument against it.
Keep export settings consistent when possible. If the original is WAV and the cleaned file is a low-bitrate MP3, the comparison is polluted by format differences. If the cleaned file is louder, the colors may appear stronger even when the artifact is not worse. Match levels by ear or with a meter before judging whether the visual change matters.
Save notes that help the next mix decision
The most useful result of an audio to spectrogram online check is not the image itself. It is a clear note that leads to the next action. Write the time, the symptom, and the decision. For example: 0:42 high whistle in vocal stem, try narrow dynamic cut. Or: 2:10 cleaned export removed cymbal fizz but vocal now dull, back off noise reduction.
A small log prevents circular work. Without notes, it is easy to brighten the master, notice fatigue, darken the vocal, lose presence, add saturation, and end up close to where you started. With notes, you can see which repair improved the song and which repair merely changed the picture. That matters when you are working with AI music because source artifacts and mix choices can blur together.
Do not use the spectrogram to chase hidden messages, visual tricks, or legal certainty. It is a music analysis tool for practical listening problems. It can show frequency energy, timing, dropouts, noise bands, and changes between exports. It cannot tell you whether a track is emotionally convincing, ready for release, or safe from copyright issues.
The simple workflow is enough for most musicians: choose a clean file, upload it, learn the axes, inspect one real problem, compare a repaired version, and write a note that points to the next mix move. When the display supports what your ears already suspect, it saves time. When it does not, return to listening and keep the picture in its proper place.