A spectrogram generator will not tell you whether a song is good, but it can show problems that ears sometimes miss when the hook is catchy or the session has been playing for too long. For AI music, the value is simple: turn the file into a frequency display, look for suspicious patterns, then go back and listen with a sharper question.
What a spectrogram can show quickly
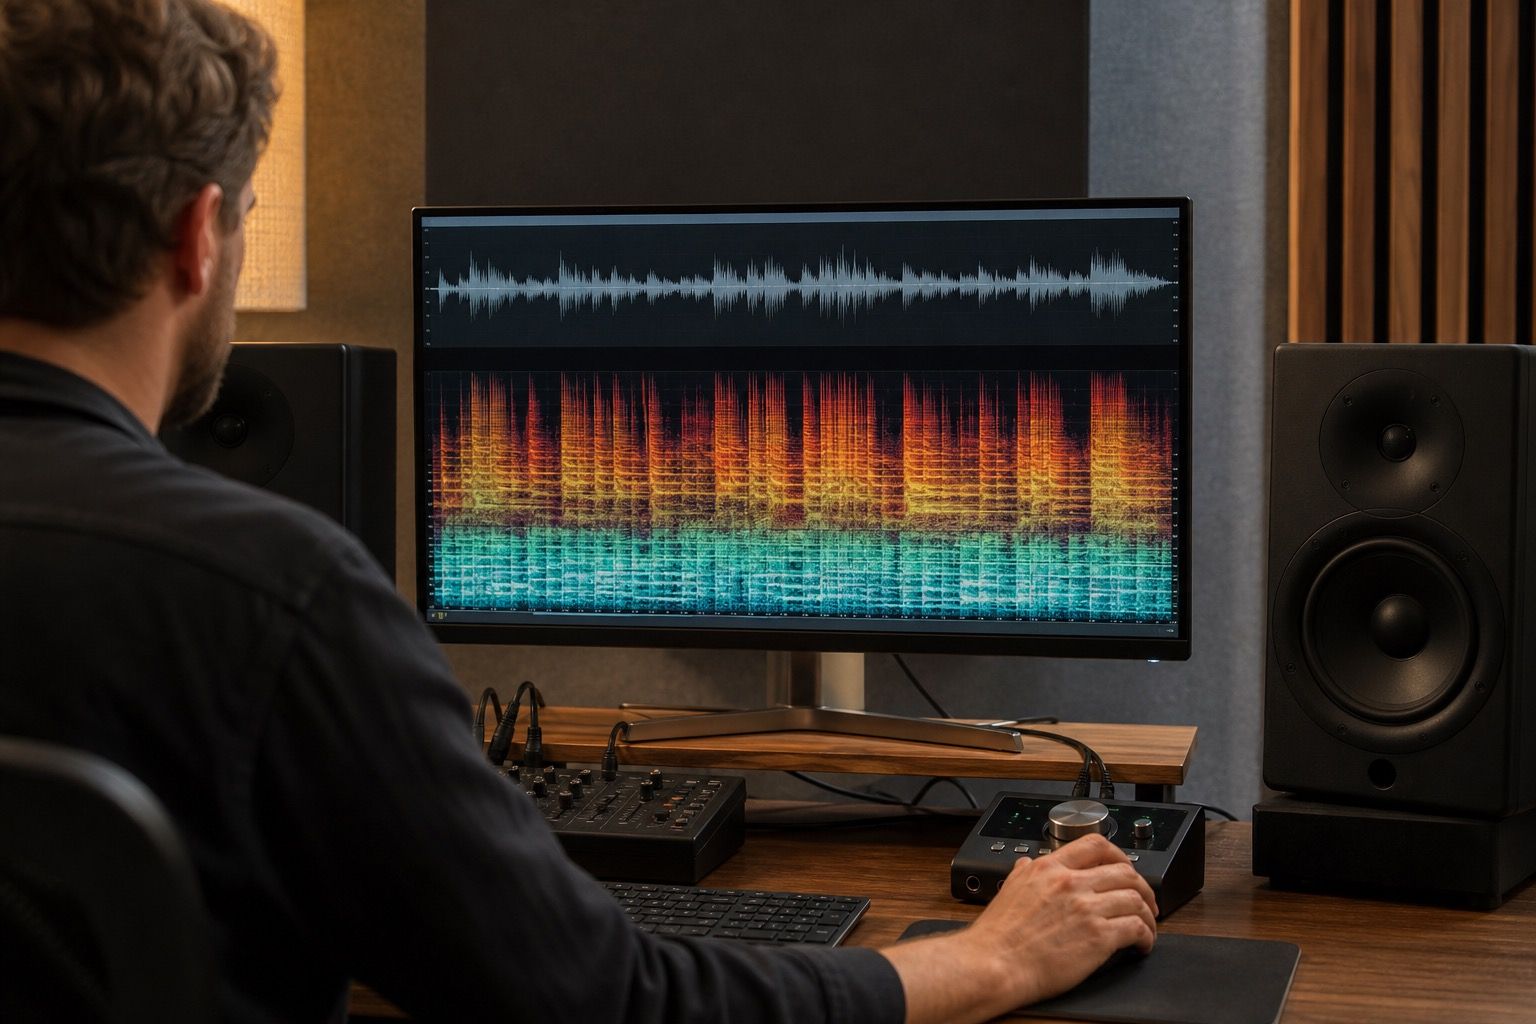
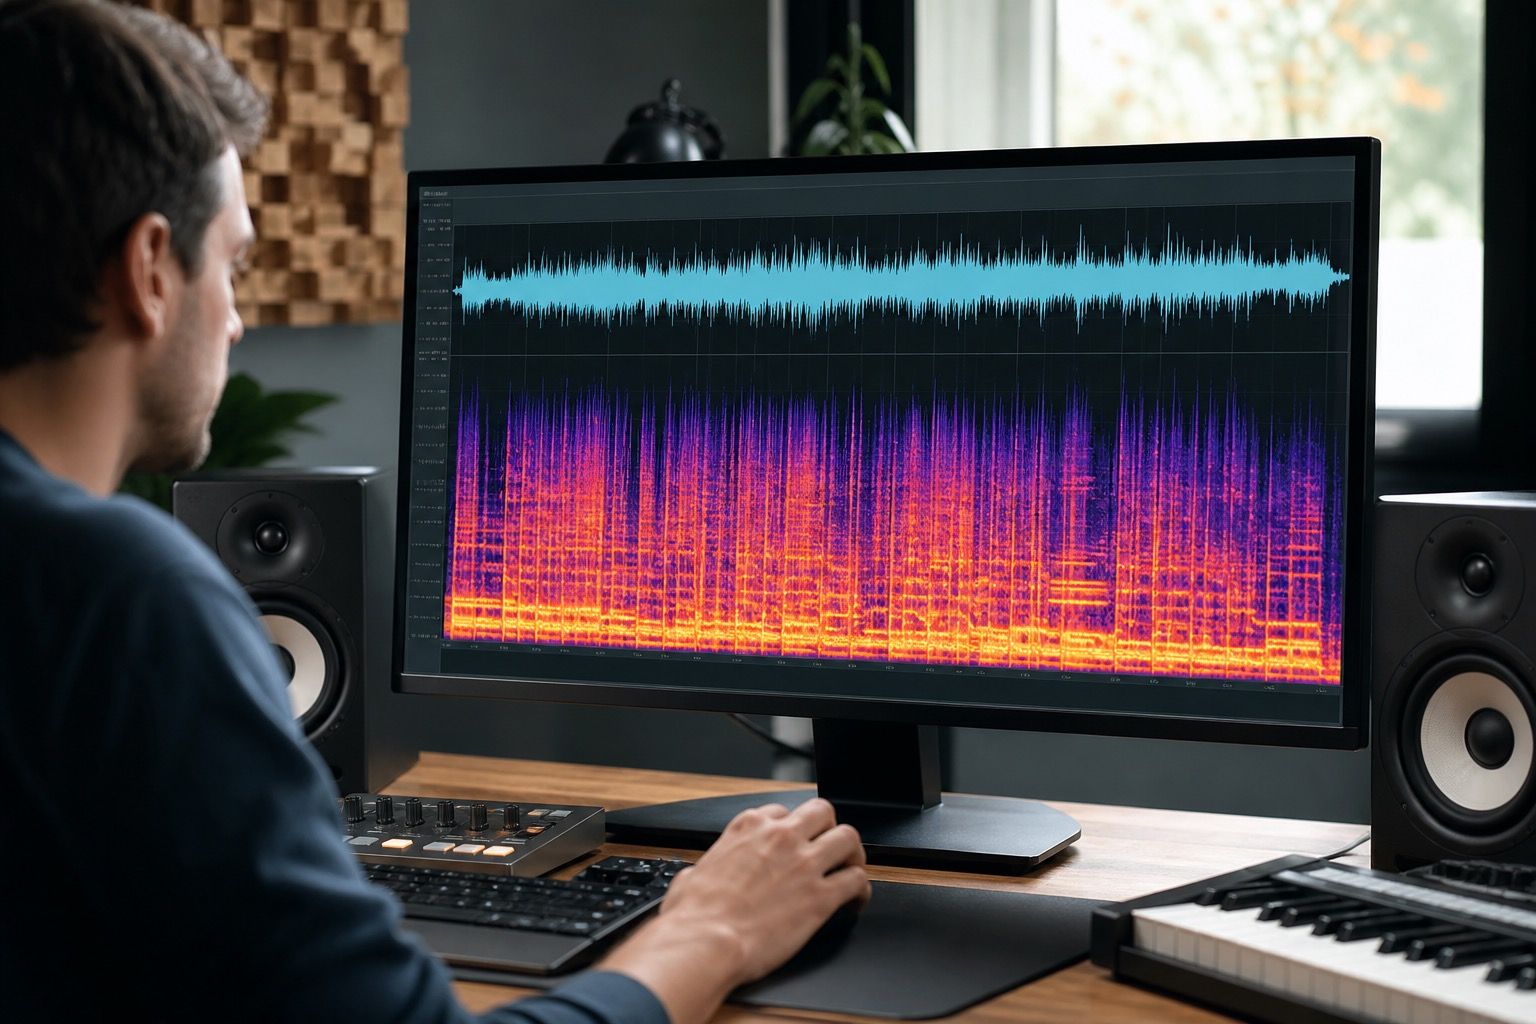
A waveform shows loud and quiet moments. A spectrogram shows where that energy sits over time. Low frequencies sit near the bottom, high frequencies near the top, and color intensity usually means stronger energy. Once you understand that basic view, an online spectrogram generator becomes a practical inspection tool rather than a strange scientific picture.
For AI music, I use it for three quick checks. First, it can reveal high-frequency haze that hangs above the track even when the arrangement should be calmer. Second, it can show horizontal noise bands that do not move with the chords, drums, or vocal. Third, it can make sudden dropouts or clipped-looking moments easier to locate before you start guessing where the problem is.
The visual view is most helpful when paired with listening. If a chorus feels sharp, the spectrogram can show whether the top band stays bright from start to finish. If a vocal has a metallic whistle, the display can help you find a thin line that repeats on certain syllables. If the file sounds dull after cleanup, a comparison view can show whether too much upper detail was removed.
Load the cleanest file you have
Start with the best available export. A WAV or FLAC file is usually a cleaner first pass than an MP3 because it has fewer compression artifacts baked into the picture. An MP3 can still be useful, especially if it is the only file you have or if you are checking the final delivery version, but do not confuse MP3 encoding marks with problems created by the AI model.
If you have stems, inspect the full mix first, then the vocal or instrumental stem that seems suspicious. The full mix shows whether the listener will actually hear the issue. A stem helps you locate the source. For example, a high band that looks alarming in the full mix may come from cymbals, a breathy vocal layer, or a bright reverb return. The display alone will not name it for you, so the file choice matters.
Keep the first pass boring and repeatable. Use the same spectrogram maker settings for the original and the cleaned export. If one view uses a different color scale, zoom, or time range, the comparison can fool you. The goal is not to make a dramatic screenshot. The goal is to see whether the same problem is still present after a repair.
Look for bands that do not move with the music
Suspicious bands are often steady. Music normally changes shape: vocals form blocks and curves, drums flash, bass notes move, and cymbals fade. A problem band may sit like a ruler across the display. It can be a whistle, electronic tone, resampling artifact, or a layer of synthetic noise that remains even when the arrangement changes.
When you find a horizontal line, do not panic. Some instruments create steady partials, and some synths are meant to hold a tone. The useful question is whether the band matches something musical. Solo the section if possible. If the line stays during a vocal pause, check the instrumental or reverb. If it appears only on certain words, the vocal generation may have created a narrow ring that needs a focused repair.
High-frequency haze is less tidy but just as important. It can look like a pale cloud at the top of the display. In AI tracks, this often appears around cymbal-like textures, breath, crowd-like backing layers, or over-bright mastering. The ear may describe it as fizz, glass, sand, or air that never turns off. A small amount can be normal. A constant sheet across the whole song usually deserves attention.
| Visual clue | Common listening symptom | Next check |
|---|---|---|
| Thin horizontal line | Whistle, ring, or metallic note | Loop the time range and test a narrow dynamic cut |
| Bright top haze | Fizz, sharp air, or listening fatigue | Compare vocal, cymbal, and reverb-heavy sections |
| Black or quiet gap | Dropout, bad edit, or missing transient | Check the same moment in the original file |
| Squared intense blocks | Clipped peaks or crushed loudness | Inspect level, limiter settings, and export format |
Compare the original and cleaned export
The best use of a spectrogram online is before-and-after comparison. Open the original file, note the exact time of the suspected problem, then open the cleaned export with the same view settings. Do not look for a completely different picture. Good cleanup is usually modest. The offending line may be softer, the haze may be less constant, or the dropout may be repaired without changing the rest of the song.
Be careful with tools that remove too much. A cleaned file can look smoother and still sound worse. If a vocal loses breath, consonants, or emotional edge, the spectrogram may show a large reduction in upper detail, but the musical result may feel flat. That is why the display should point your ear, not replace it. The final question is still whether the track plays better.
I also like to compare the final master against the pre-master. If harshness appears only after mastering, the problem may be limiter behavior, added saturation, or a high-shelf boost. If the same band exists in both versions, the artifact is probably earlier in the chain. That distinction saves time because you stop trying mastering fixes for a problem that lives in the generated source.
Use the image as evidence, not as a verdict
A spectrogram generator is strongest when it helps you make a specific decision. Should you re-export from the AI tool? Should you clean the vocal stem? Should you lower a bright percussion layer? Should you use a gentler master? The image can support those decisions, but it cannot understand context. A dense EDM chorus should not look like a sparse acoustic verse.
Overinterpretation is the easiest mistake. Every mark does not need repair. Every bright band is not an artifact. Some of the most musical parts of a track look messy on purpose. If the song sounds good and the visual mark has no listening symptom, leave it alone. Use the spectrogram when there is a real complaint: fatigue, hiss, ringing, clipped moments, strange silence, or a cleaned export that lost life.
Save notes with time stamps rather than collecting random screenshots. A useful note says 1:12 chorus top haze reduced in cleaned export, or 0:48 vocal whistle still present around the word stay. That note helps the next mix decision. A folder full of unlabeled spectrogram images usually becomes visual clutter, and clutter is not quality control.
The practical workflow is small: load the cleanest file, inspect the suspicious moment, compare an export, then listen again at a normal level. When the picture and the ear point to the same issue, you can fix with confidence. When they disagree, trust the listener experience and use the display only to keep your search organized.